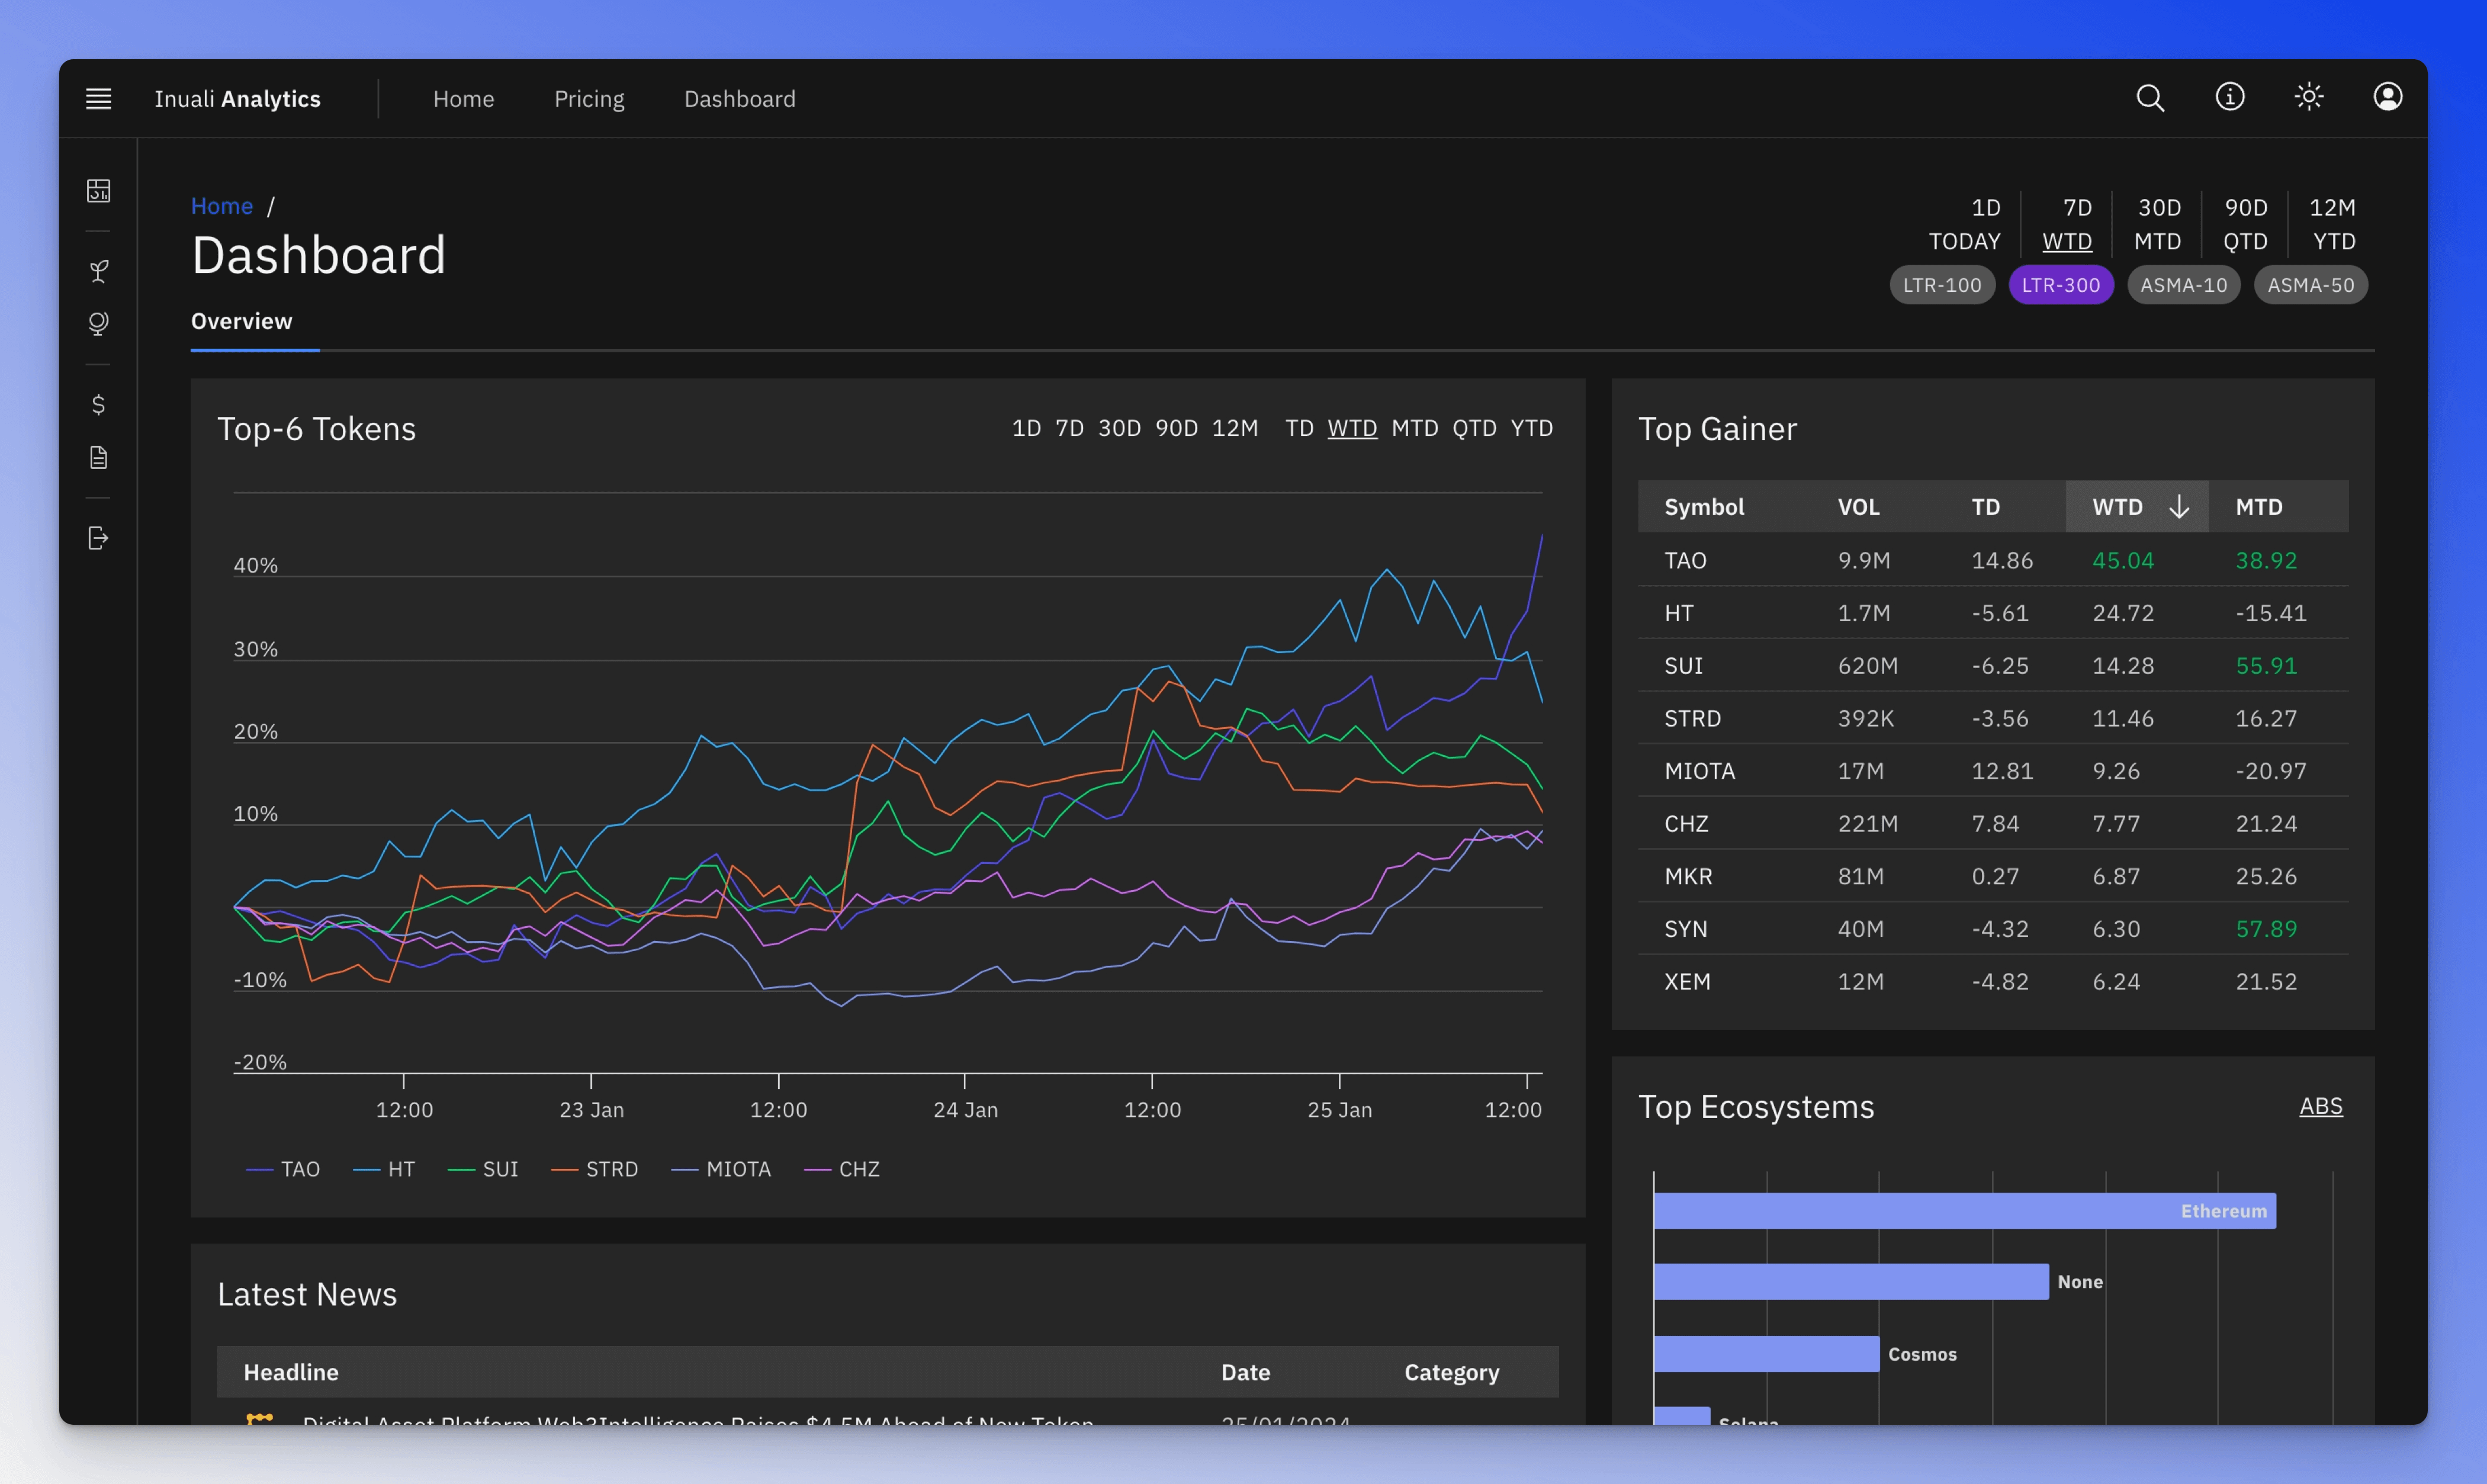
Dashboard
The Dashboard is the starting point of your research. Here you can find the most important information about the crypto market.
Leaders
The leader graph displays the six assets with the strongest relative performance during the chosen time period and filter settings.
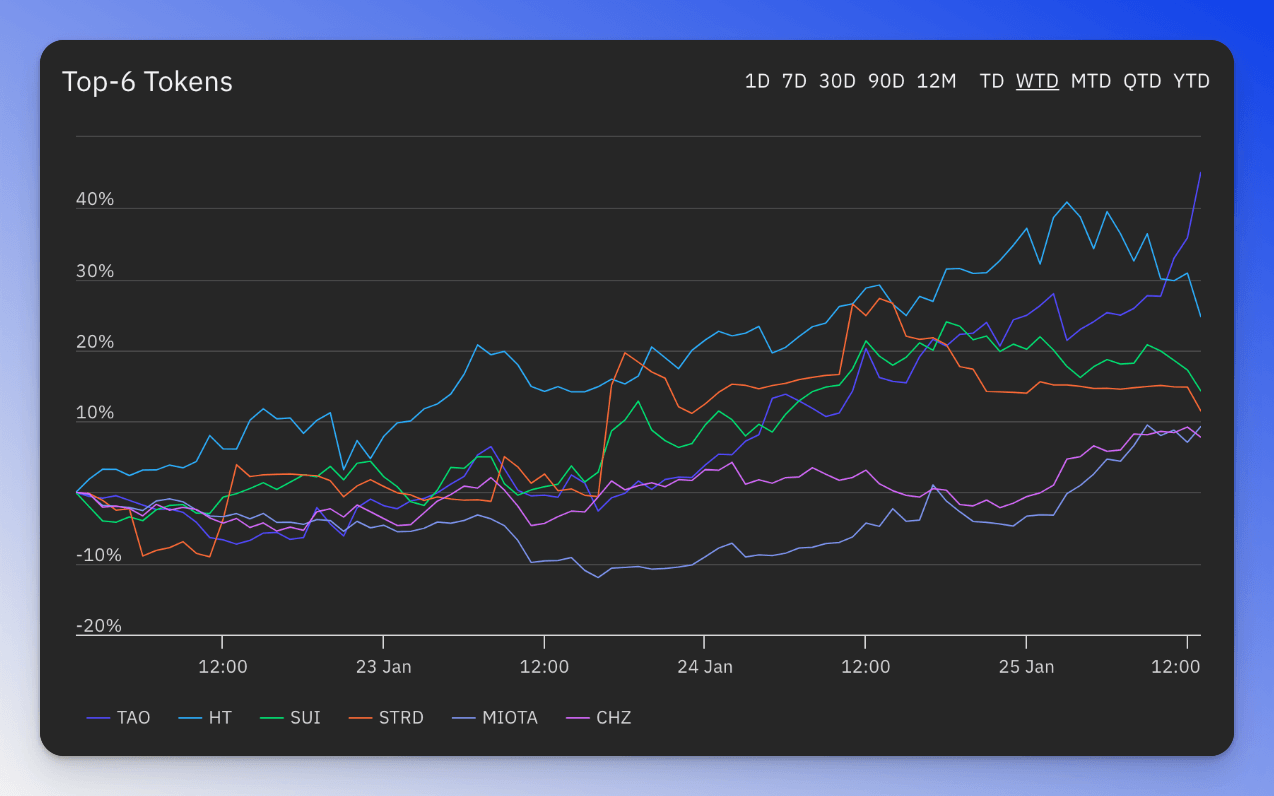
Utilize the time selector to modify the time interval displayed but please note that changing the interval will not alter or recalculate the results. For more comprehensive adjustments, use the main time and filter selector located at the top right of the page.
Click (or double-tap on touch devices) on an asset graph to view the token details.
Top Tokens
The Top Tokens table shows the best-performing assets in a tabular format.
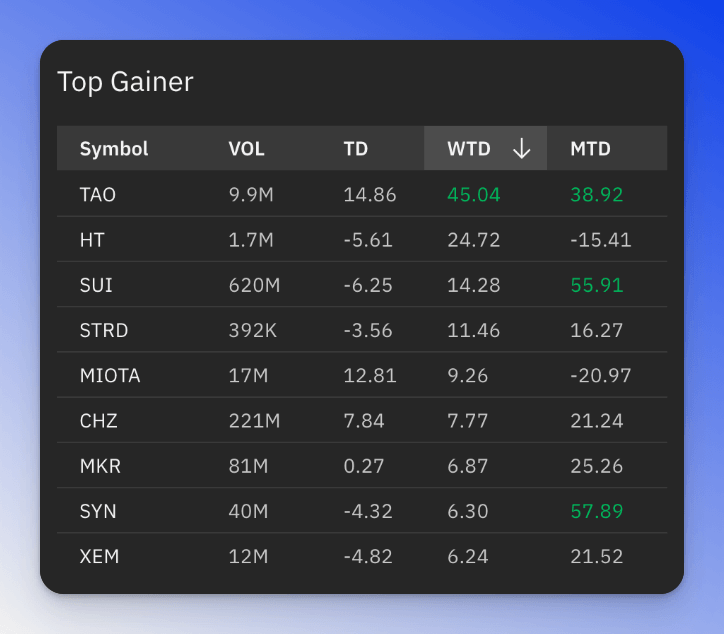
The content and columns of the table are determined by the page time and filter settings.
WTD, YTD, WTF? Confused by these? Check out our vocabulary section.
Time and Filter Selection
The Time and Filter component is a feature you'll frequently encounter on Inuali. While the specific settings may vary across different pages, the underlying concept remains consistent. This component enables you to adjust the time range and filter settings for the entire page.
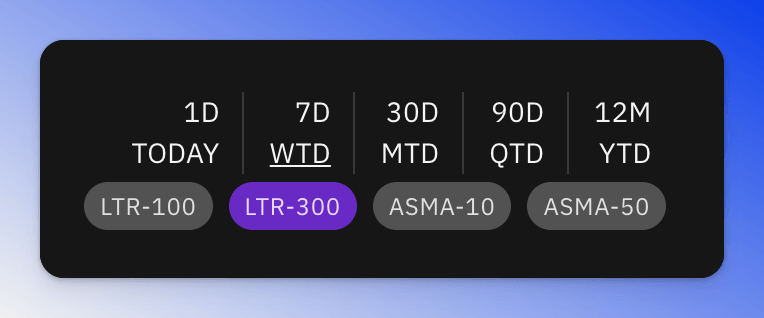
The available filter settings on the Dashboard page are:
- LTR-100: Show Tokens with "Marketcap Rank < 100"
- LTR-300: Show Tokens with "Marketcap Rank < 300"
- ASMA-10: Show Tokens Trading "Above Simple Moving Average 10"
- ASMA-50: Show Tokens Trading "Above Simple Moving Average 50"
For term explanations see vocabulary.
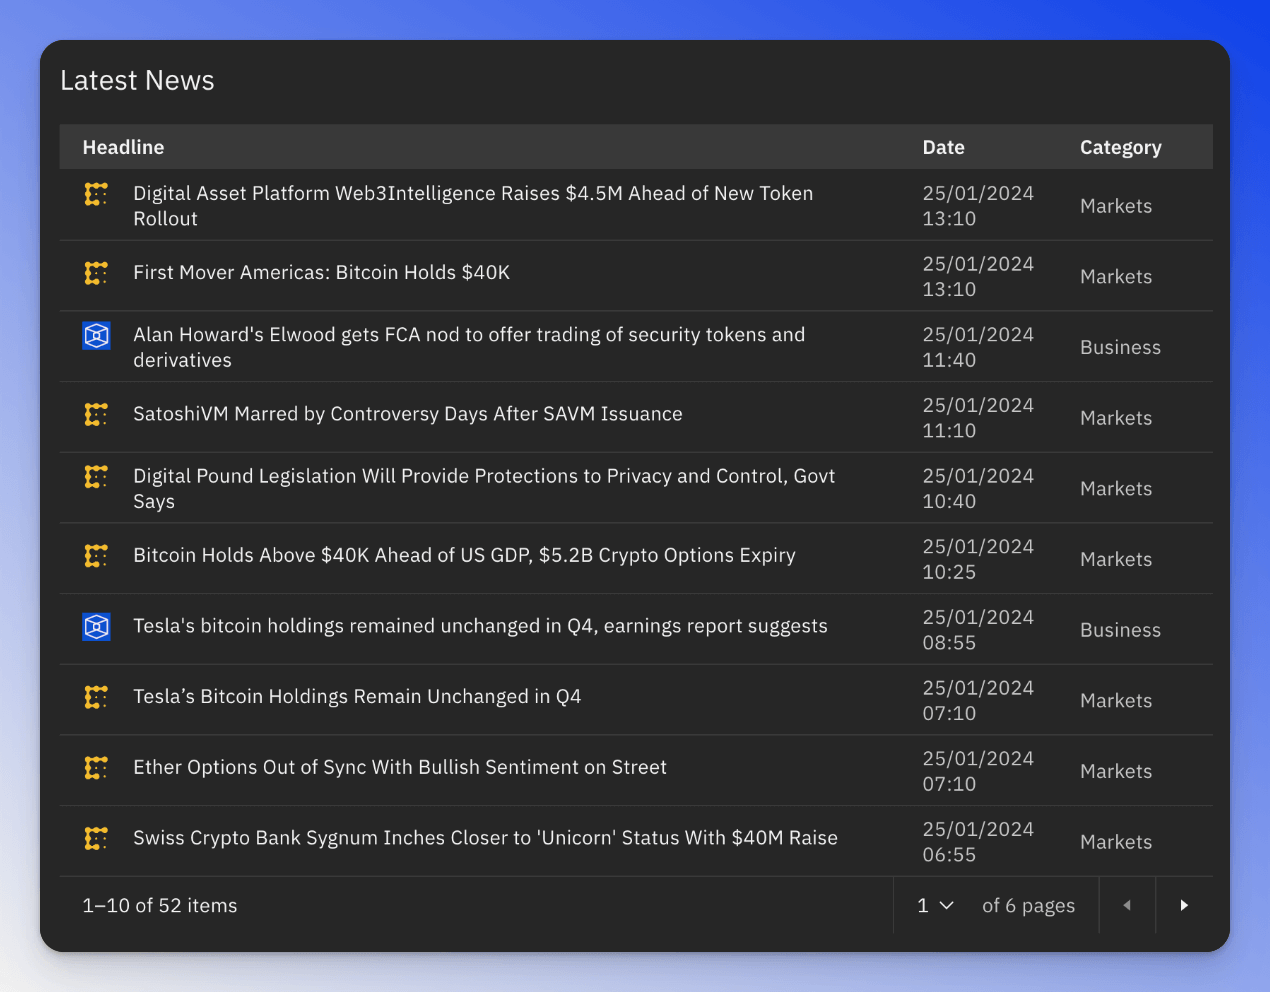
Latest News
In this section you can find recent news stories from the most important publications.
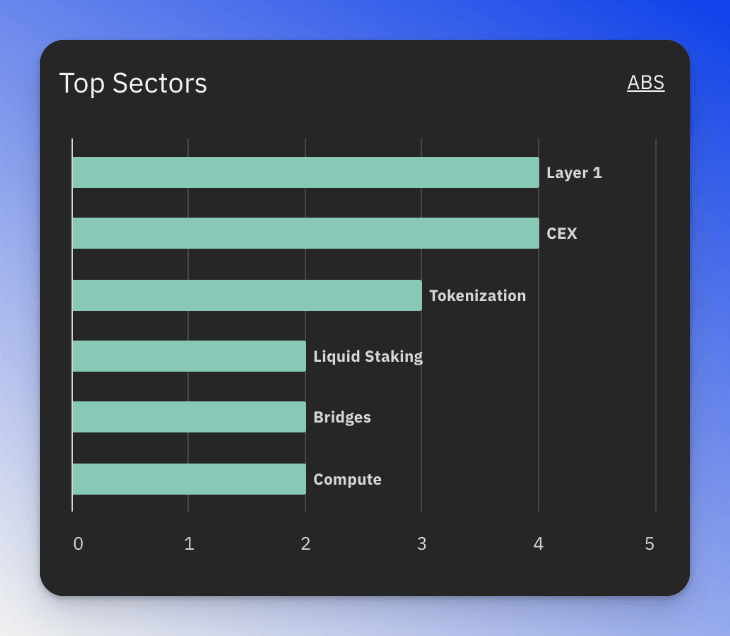
Top Ecosystems and Sectors
These charts are designed to easily identify the top-performing ecosystems and sectors. The charts are generated by calculating the ratio of occurrences among the 24 best-performing tokens.